Simulating stress-strain curves with DAMASK#
This notebook processes the results from the demo workflow tension_DAMASK_Al, and generates a plot of stress-strain.
import matflow as mf
import matplotlib.pyplot as plt
import numpy as np
from pathlib import Path
Load and process simulation#
workflow_path = Path("tension_DAMASK_Al_2025-05-29_115126")
workflow = mf.Workflow(workflow_path)
VE_response = workflow.tasks.simulate_VE_loading_damask.elements[0].outputs.VE_response.value

stress = np.array(VE_response['phase_data']['vol_avg_equivalent_stress']['data'])
strain = np.array(VE_response['phase_data']['vol_avg_equivalent_strain']['data'])
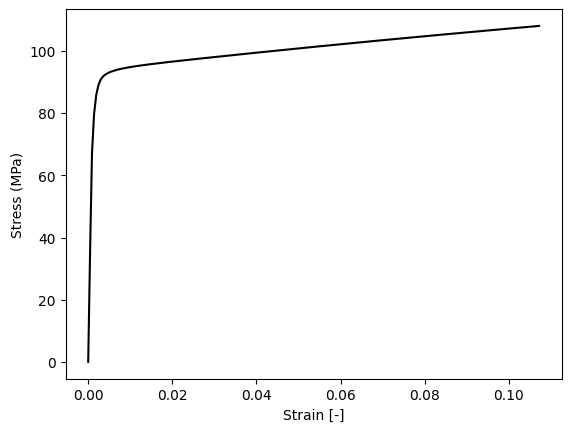
Plot stress-strain#
plt.plot(strain, stress/1e6, color='k')
plt.xlabel(f"Strain [-]")
plt.ylabel(f"Stress (MPa)")
Text(0, 0.5, 'Stress (MPa)')